Table of Contents
Explore data by using a card of the overview page
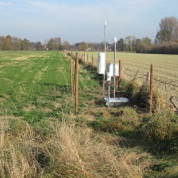
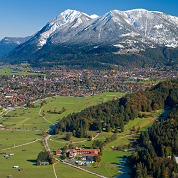
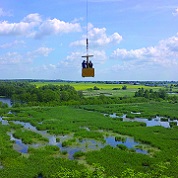
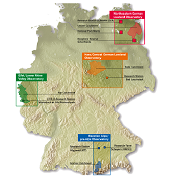
 When you click on one of the first tiles, all measuring stations of an observatory or of a certain category are shown on a map and (where appropriated) grouped by colors. All tiles are explained above:
Find measurement stations by location or name of measurement site
This use case explains how to find data when location or the name of the observation site is already known by the user. When starting from the main page (tiles page) you have to click on button “Map Search”. In TERENO we have several locations, where much data for different scientific domains are collected, e.g. the test sites in
- Rollesbroich
- Wuestebach
- Selhausen …
Let start with search for data from the rollesbroich test site. The easiest way is to use the free text search controls (see figure).  When you are typing the site name (here rollesbroich) into the search field, the system gives you hints to your search term. In this case it lists all stations, which starting with RO. With this you can find all station from rollesbroich, because all of this starting with capital RO letters. Here you can find the naming schema the TERENO Stations.
Predefined Spatial Filter
Another possibility to search data when site name is known is to use the predefined spatial filter. In the search options you can choose Where and select the site name in the Regions drop down list. (see figure). Click on “search” button performs the search. The search result contains all stations within the test site.

Full SoilNet Dataset (NetCDF)
Due to the large data volume of the SoilNet data set and the associated complexity of the download, we provide the entire data set as annual (Wuestebach) or monthly (Rollesbroich) files in NetCDF format: https://service.tereno.net/thredds/terenoCatalog.html

