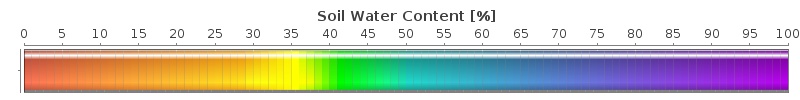
Interpolated soil moisture data from the SoilNet sensor network in the Wüstebach test site
R. Kunkel, D. Ecker, T. Korf und J. Sorg
| 0.05m | 0.2m | 0.5m |
|---|---|---|
 | ||
The Wüstebach test site is located in the German low mountain range in the southern part of the Rur catchment. The site covers the area (38.5 ha) of the small catchment of the Wüstebach, with altitudes ranging from 595 to 628 m a.s.l. and represents a typical spruce forest vegetation type area. Since 2008 soil moisture is measured continuously at 150 locations within the test site using a wireless sensor network (SoilNet, Bogena et al., 2010) at three depths (5, 20, 50 cm). Soil moisture measurements are made every 15 minutes (Rosenbaum et al., 2012). 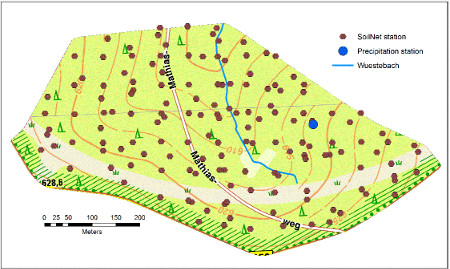
For the time period of the Flood event soil moisture data are interpolated for 30 minutes intervals into a 5x5 m grid for each depth by Ordinary Kriging. Semivariograms are estimated for each time step and depth using a spherical model. Validity of the Kriging estimation is checked by cross validation. For each time step a reporting document is created and stored to allow for further analyses. |
The interpolated data are stored in a spatial database (PostgreSQL/PostGIS) along with descriptive metadata. Access to the data/metadata is given by a standardized OGC compliant Sensor Observation Service (SOS) for raster data (Sorg et al., 2015). The application below retrieves the interpolated data as images for each depth from the RasterSOS. To create the animation each raster layer is displayed for 500 ms before the next one is shown. Shown precipitation data are measured with an Ott Pluviometer at one of the climate stations at the test site (Graf et al., 2014), which is located in the deforested area east of the “Matthiasweg” (see Figure 1). The RasterSOS supports retrieving spatial filtered data, which enables to retrieve and visualize time series of one point of the observed area. Clicking on a site within one of the map windows opens a popup window showing the temporal evolution of the interpolated soil moisture data in the selected time period, even for points, which do not contain an observation station. 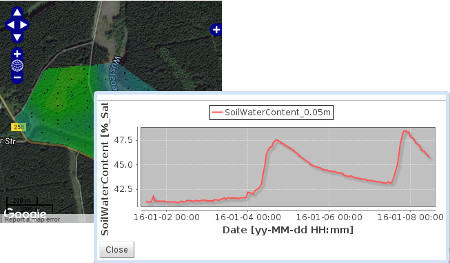
|
Literature | |
| |