| 0.05m | 0.2m | 0.5m |
|---|---|---|
 | ||
Interpolated soil moisture data from the SoilNet sensor network in the Wüstebach test site
K. Rötzer, J. Sorg and R. Kunkel
The Wüstebach study site is located in the German low mountain range within the borders of the Eifel National Park near the German-Belgian border. The site covers the area (38.5 ha) of the small catchment of the Wüstebach, with altitudes ranging from 595 to 628 m a.s.l.. It represents the typical, but not natural, spruce forest vegetation type of the region with Norway Spruce (Picea abis L.) as prevailing tree species. During late summer/early autumn of 2013, trees were almost completely removed in an area of 9 ha by the national park forest management in order to promote the natural regeneration of near-natural deciduous forest from spruce monoculture forest. Strong effects are expected on soil, water quality, exchange processes and composition of flora and fauna due to the imposed disturbance that will provide a unique insight into the recovery and regeneration of forest systems (you can find details here). 
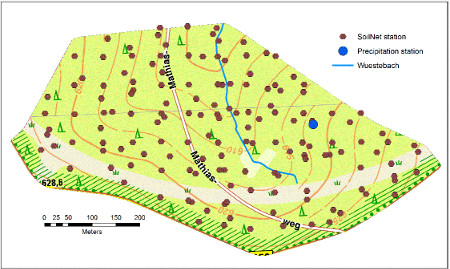
Soil moisture is measured continuously with the wireless sensor network SoilNet (Bogena et al., 2010). The sensor network in the Wüstebach test site was installed in 2008 and consists of 150 end device units. At each end device, soil moisture is measured at three depths (5, 20, 50 cm) using horizontally installed ECH2O sensors (EC-5 and 5TE, Decagon Devices Inc., Pullman, USA). In addition, two sensors are installed at the same depth with a separation of only 0.05 m. At 5 and 50 cm depths, one EC-5 and one 5TE sensor and at 20 cm depth, two EC-5 sensors are installed. Soil moisture measurements are made every 15 minutes (Rosenbaum et al., 2012). Precipitation data shown in this application are measured with an Ott Pluviometer at one of the climate stations at the test site (Graf et al., 2014), which is located in the deforested area east of the “Matthiasweg” (see Figure 1). If data are not available for the chosen time period, preciptation data from the nearby located Schoeneseiffen station is displayed. |
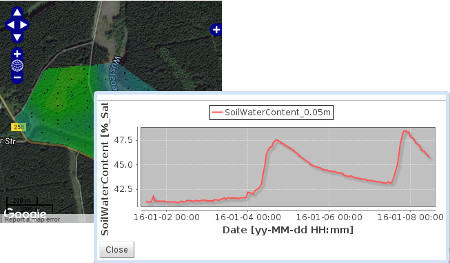
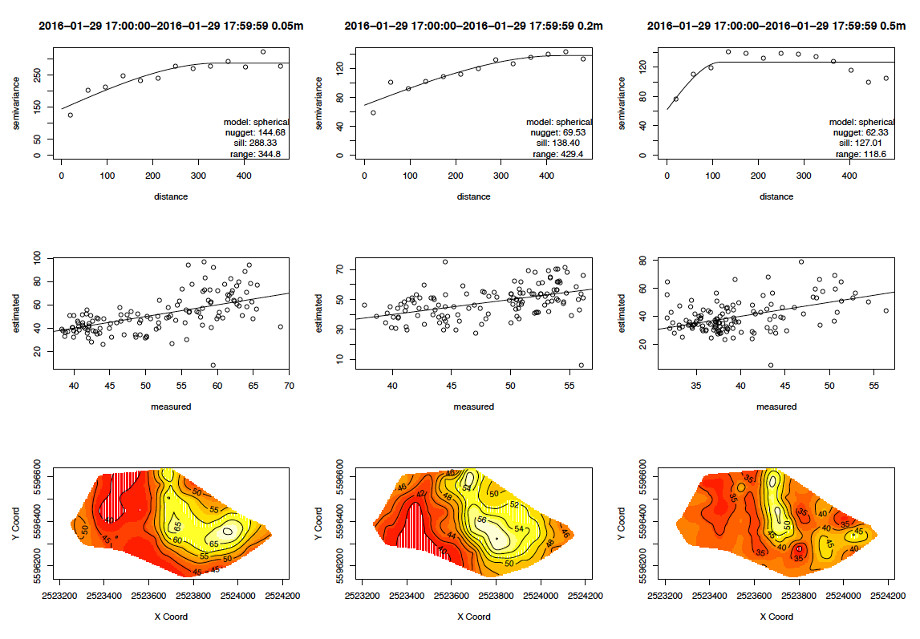
Soil moisture data are interpolated into a 5x5 m grid for each depth by Ordinary Kriging using the daily mean of the maximum value of the two sensors measurements at each depth. Obviously wrong data or data, which have been assigned as being incorrect are not used. Semivariograms are estimated for each time step and depth using a spherical model. Validity of the Kriging estimation is checked by cross validation. For each time step a reporting document is created and stored to allow for further analyses (Figure 2). The interpolated data generated by the regionalization process is stored in a spatial database (PostgreSQL/PostGIS) along with descriptive metadata. Access to the data/metadata is given by a standardized OGC compliant Sensor Observation Service (SOS) for raster data (Sorg et al., 2015). An OGC compliant SOS for in-situ data standardizes precipitation time series access. After the initialization process of the web application the retrieved raster data layers from the RasterSOS are overlaid to a Google Map for each depth. To create the animation each raster layer is displayed for 500ms before the next one is shown. The time stamp of the actual visible raster record is determined by the blue time line running over the precipitation plot at the top of the web page. Because the OpenLayers geographic library is used to display the layers, zooming in and out as well as moving the displayed region is supported. The control area at the upper right part of the web page allows to select a custom time period and to navigate within the loaded time interval. The RasterSOS supports retrieving spatial filtered data, which enables to retrieve and visualize time series of one point of the observed area. Clicking on a site within one of the map windows opens a popup window showing the temporal evolution of the interpolated soil moisture data in the selected time period (see Figure 3), even for points, which do not contain an observation station. 
|
 | |
Literature | |
| |